


Yuki Tsunoda was the constant in AlphaTauri’s line-up this year, but one of his trio of team mates fared far worse than the others.
Team mates head-to-head articles archive
Every Formula 1 driver knows only one of their rivals has exactly the same car that they do. Team mates need to work together to move their team forward – but each driver knows that it’s essential for their standing in the paddock to put up a competitive showing against their rival in the other garage.
We pit each pair of drivers head-to-head in this series of articles to judge who holds the upper hand in every team based on their performances in qualifying and races.

Leclerc turns the tables on Sainz at last race in another close fight at Ferrari
2023 F1 team mates head-to-head
Posted onFor the second time in three years Ferrari’s closely-matched team mates swapped championship places at the final round.

Strong second half of Piastri’s debut season will put Norris on alert for 2024
2023 F1 team mates head-to-head
Posted onA strong debut season for Oscar Piastri, especially in the second half, will give Lando Norris plenty to think about for next year.

Russell can’t repeat points win over Hamilton but proves a close match again
2023 F1 team mates head-to-head
Posted onAfter two seasons, George Russell has the best scoring rate against Lewis Hamilton than any of his team mates since Jenson Button.
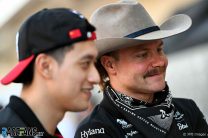
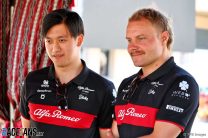
Zhou raises his game but Bottas still lays down the law at Alfa Romeo
2023 F1 team mates head-to-head
Posted onZhou Guanyu may have scored the same number of points as he did in his rookie season, but he did a better job in a weaker car.

Hulkenberg overshadows Magnussen on return, but both have little to celebrate
2023 F1 team mates head-to-head
Posted onNico Hulkenberg justified Haas’s decision to give him his first full-time seat for four years, but neither he nor Kevin Magnussen had much to work with.

Perez’s progress is reversed as team mate Verstappen obliterates all opposition
2023 F1 team mates head-to-head
Posted onSergio Perez appeared to have taken a step forward at Red Bull last season, but Max Verstappen blew him away in their third year as team mates.

Alpine’s third choice narrowly out-scores Ocon in his first season at team
2023 F1 team mates head-to-head
Posted onPierre Gasly took the Alpine seat two other drivers had turned down, then out-scored team mate Esteban Ocon despite being frustrated by the team’s tactics.

Stroll reaches 100 qualifying defeats in 136 starts at hands of latest team mate
2023 F1 team mates head-to-head
Posted onLance Stroll has never out-qualified a team mate over a season of Formula 1. This season Fernando Alonso inflicted his 100th defeat in 136 races.

Why have Williams kept the faith in Sargeant after heavy defeat to Albon?
2023 F1 team mates head-to-head
Posted onRookie Logan Sargeant was vastly out-performed by his more experienced team mate Alexander Albon this year. Why have Williams kept him?

Little to choose between Alpine pair but too many points have been missed
2023 F1 team mate battles
Posted onAlpine’s new driver pairing have collided twice in their first 12 races together and lost points on several other occasions.

Norris leads the way at McLaren but can’t afford to ignore potential of Piastri
2023 F1 team mate battles
Posted onLando Norris has comfortably out-scored his new team mate so far but Oscar Piastri is getting closer all the time.

There’s no doubt where the most one-sided team mate contest is
2023 F1 team mate battles
Posted onLogan Sargeant is the first driver to use the number two in F1 since Stoffel Vandoorne in 2018. And Sargeant is faring no better than his predecessor.

Hamilton reasserts himself over Russell as Mercedes change direction with W14
2023 F1 team mate battles
Posted onGeorge Russell out-scored Lewis Hamilton last year but the seven-times champion has hit back since Mercedes abandoned its ‘zero’ sidepods.

Tsunoda makes solid start as de Vries’ replacement provides toughest test yet
2023 F1 team mate battles
Posted onWhat was supposed to be Nyck de Vries’ first full year as an F1 driver ended after 10 rounds, and now Daniel Ricciardo is the benchmark for Yuki Tsunoda to beat.

Stroll’s points shortfall could leave Aston Martin fifth instead of second this year
2023 F1 team mate battles
Posted onAston Martin should be second in the championship, but as one driver has scored less than a quarter of their points the team is punching below its weight.

Magnussen has a fight on his hands against new team mate
2023 F1 team mate battles
Posted onKevin Magnussen led the way at Haas last year but he faces much tougher competition from Nico Hulkenberg now.

Supreme Verstappen ensures Perez’s spell as a championship contender is brief
2023 F1 team mate battles
Posted onSergio Perez began the season looking like a championship contender but his team mate Max Verstappen soon asserted his supremacy.
Zhou’s improving form is asking more questions of Bottas
2023 F1 team mate battles
Posted onZhou Guanyu has picked up where he left off last year, giving his experienced and race-winning team mate a close run.
Leclerc rebounds from early setbacks to overtake Sainz ahead of summer break
2023 F1 team mate battles
Posted onCarlos Sainz Jnr capitalised on his team mate’s troubles in the opening races, but Charles Leclerc has forged ahead at mid-season.