


2011 F1 Driver Rankings – A statistical analysis
- This topic has 2 replies, 2 voices, and was last updated 12 years, 3 months ago by
 Magnificent Geoffrey.
- AuthorPosts
- 31st December 2011, 22:49 at 10:49 pm #130685
Aussie Rod
ParticipantComparing drivers in different machinery is an impossible task to do with any certainty, and opinion will always play a part in any such discussion. FWIW I thought Keith’s driver rankings for 2011 was an excellent article, and I agreed with much of it. However reading it (and many others) got me thinking… is there a way to establish a points system to rank drivers at year end that takes away the advantage, or disadvantage, of the car?
Below is my attempt.
***
I think there are two main performance indicators with which drivers can be equally assessed:
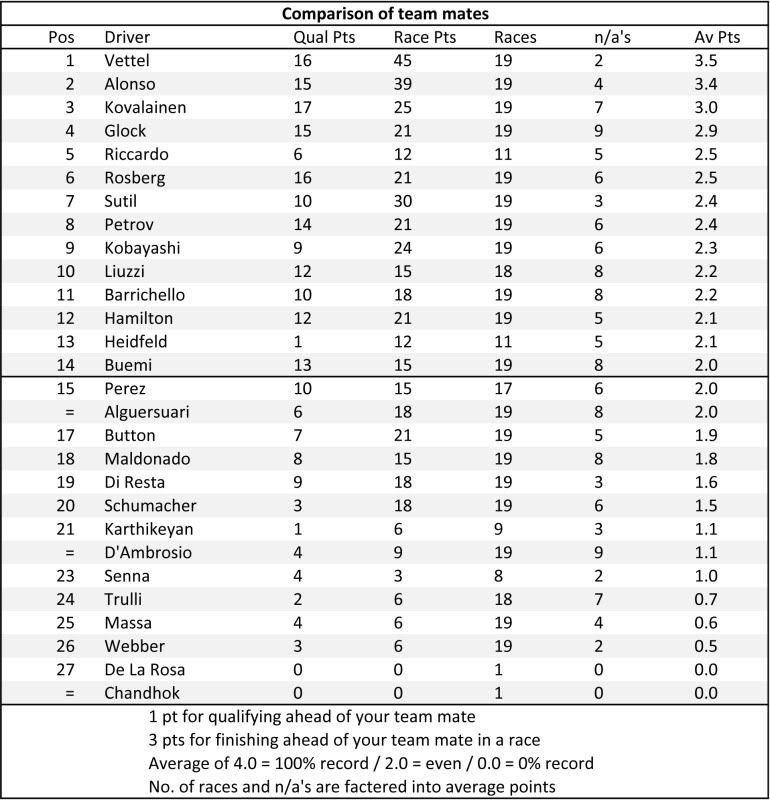
1) Team mate comparison.
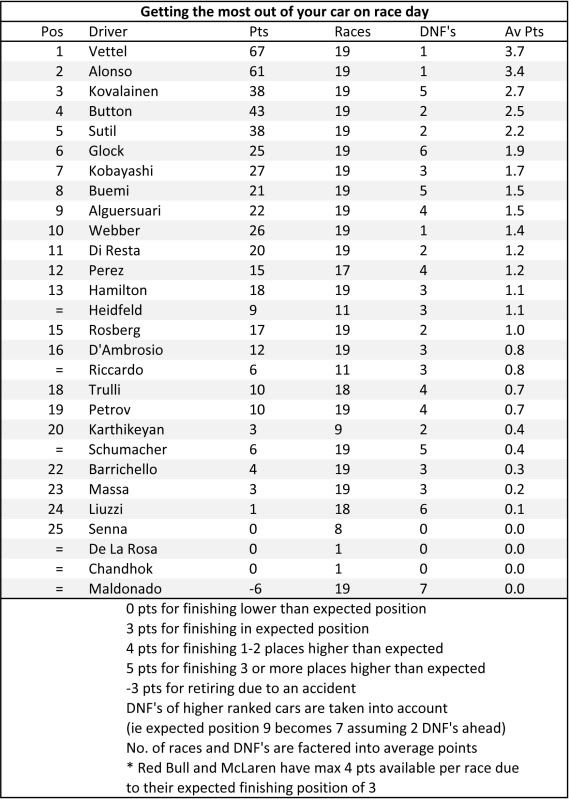
Comparing qualifying and race results between team mates shows how much a particular driver got out of their car. If a driver dominates his team mate, this goes some way to demonstrating that they got as much out if their car as they can. I have awarded points for out-qualifying (1pt) and out-racing (3pts) your team mate.2) Getting the most out of your car on race-day.
Each team has an expected finishing position assuming all cars finish the race. It varies race-by-race, and depending on grid position, but the strategists largely know where their drivers are expected to come home. For Mercedes, this year it was mostly 7th, behind the Red Bulls, McLarens and Ferrari. Assuming no problems to the cars ahead this was as good as they could do. Red Bull however, would expect a podium at every race. So a 7th for Rosberg could be seen as being equal to a podium for Vettel.I have applied this logic to each driver, giving each team an expected finish position largely based on the end-of-year constructors standings. Each driver has then been assessed against this expected position. Points have been awarded for drivers who finish in their expected position (3pts), 1 or 2 places ahead (4pts) or 3 or more places ahead (5pts). By taking into account retirements (ie expected position 7th becomes 5th if their are two retirements from cars who were expected to beat you) you can see that for a driver to beat their expected position is very, very difficult.
***
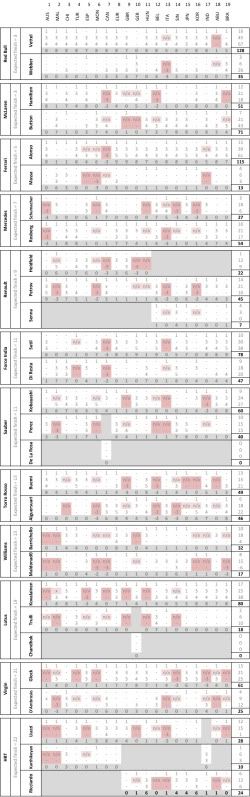
The results of all this are shown in the attachments below (hopefully they display correctly, otherwise cut and paste the link). I think the results are more a reflection on which drivers ‘got the most out of their car’ rather than ‘who was the best’ although some might argue that these are one and the same. Kovalainen is a perfect example. He got the most he possibly could out of the Lotus, but how does this compare with Vettel who similarly got the most out of the Red Bull? It is a point of debate and opinion whether one deserves more merit than the other, simply because of the different ends of the grid their respective exploits were taking place.
Have a read through, and let me know if you would like any further explanation on how results were calculated.
I hope you enjoy!
Rod
 31st December 2011, 22:51 at 10:51 pm #188318Participant
Ok, looks like the links didn’t work so you will have to cut and paste. Sorry.
Link 1: Table of results
Link 2: Team mate comparison standings
Link 3: Race day performance standings
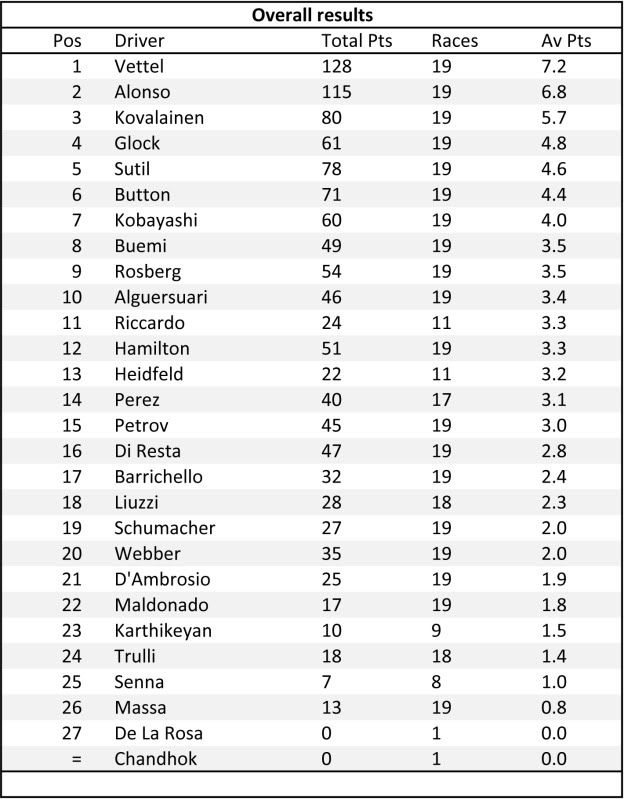
Link 4: Overall standings
31st December 2011, 22:55 at 10:55 pm #188319 Magnificent GeoffreyParticipant
Kobayashi? 7th best performer overall? I like these stats. Cheers!
- AuthorPosts
- You must be logged in to reply to this topic.